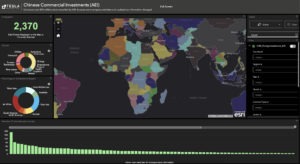
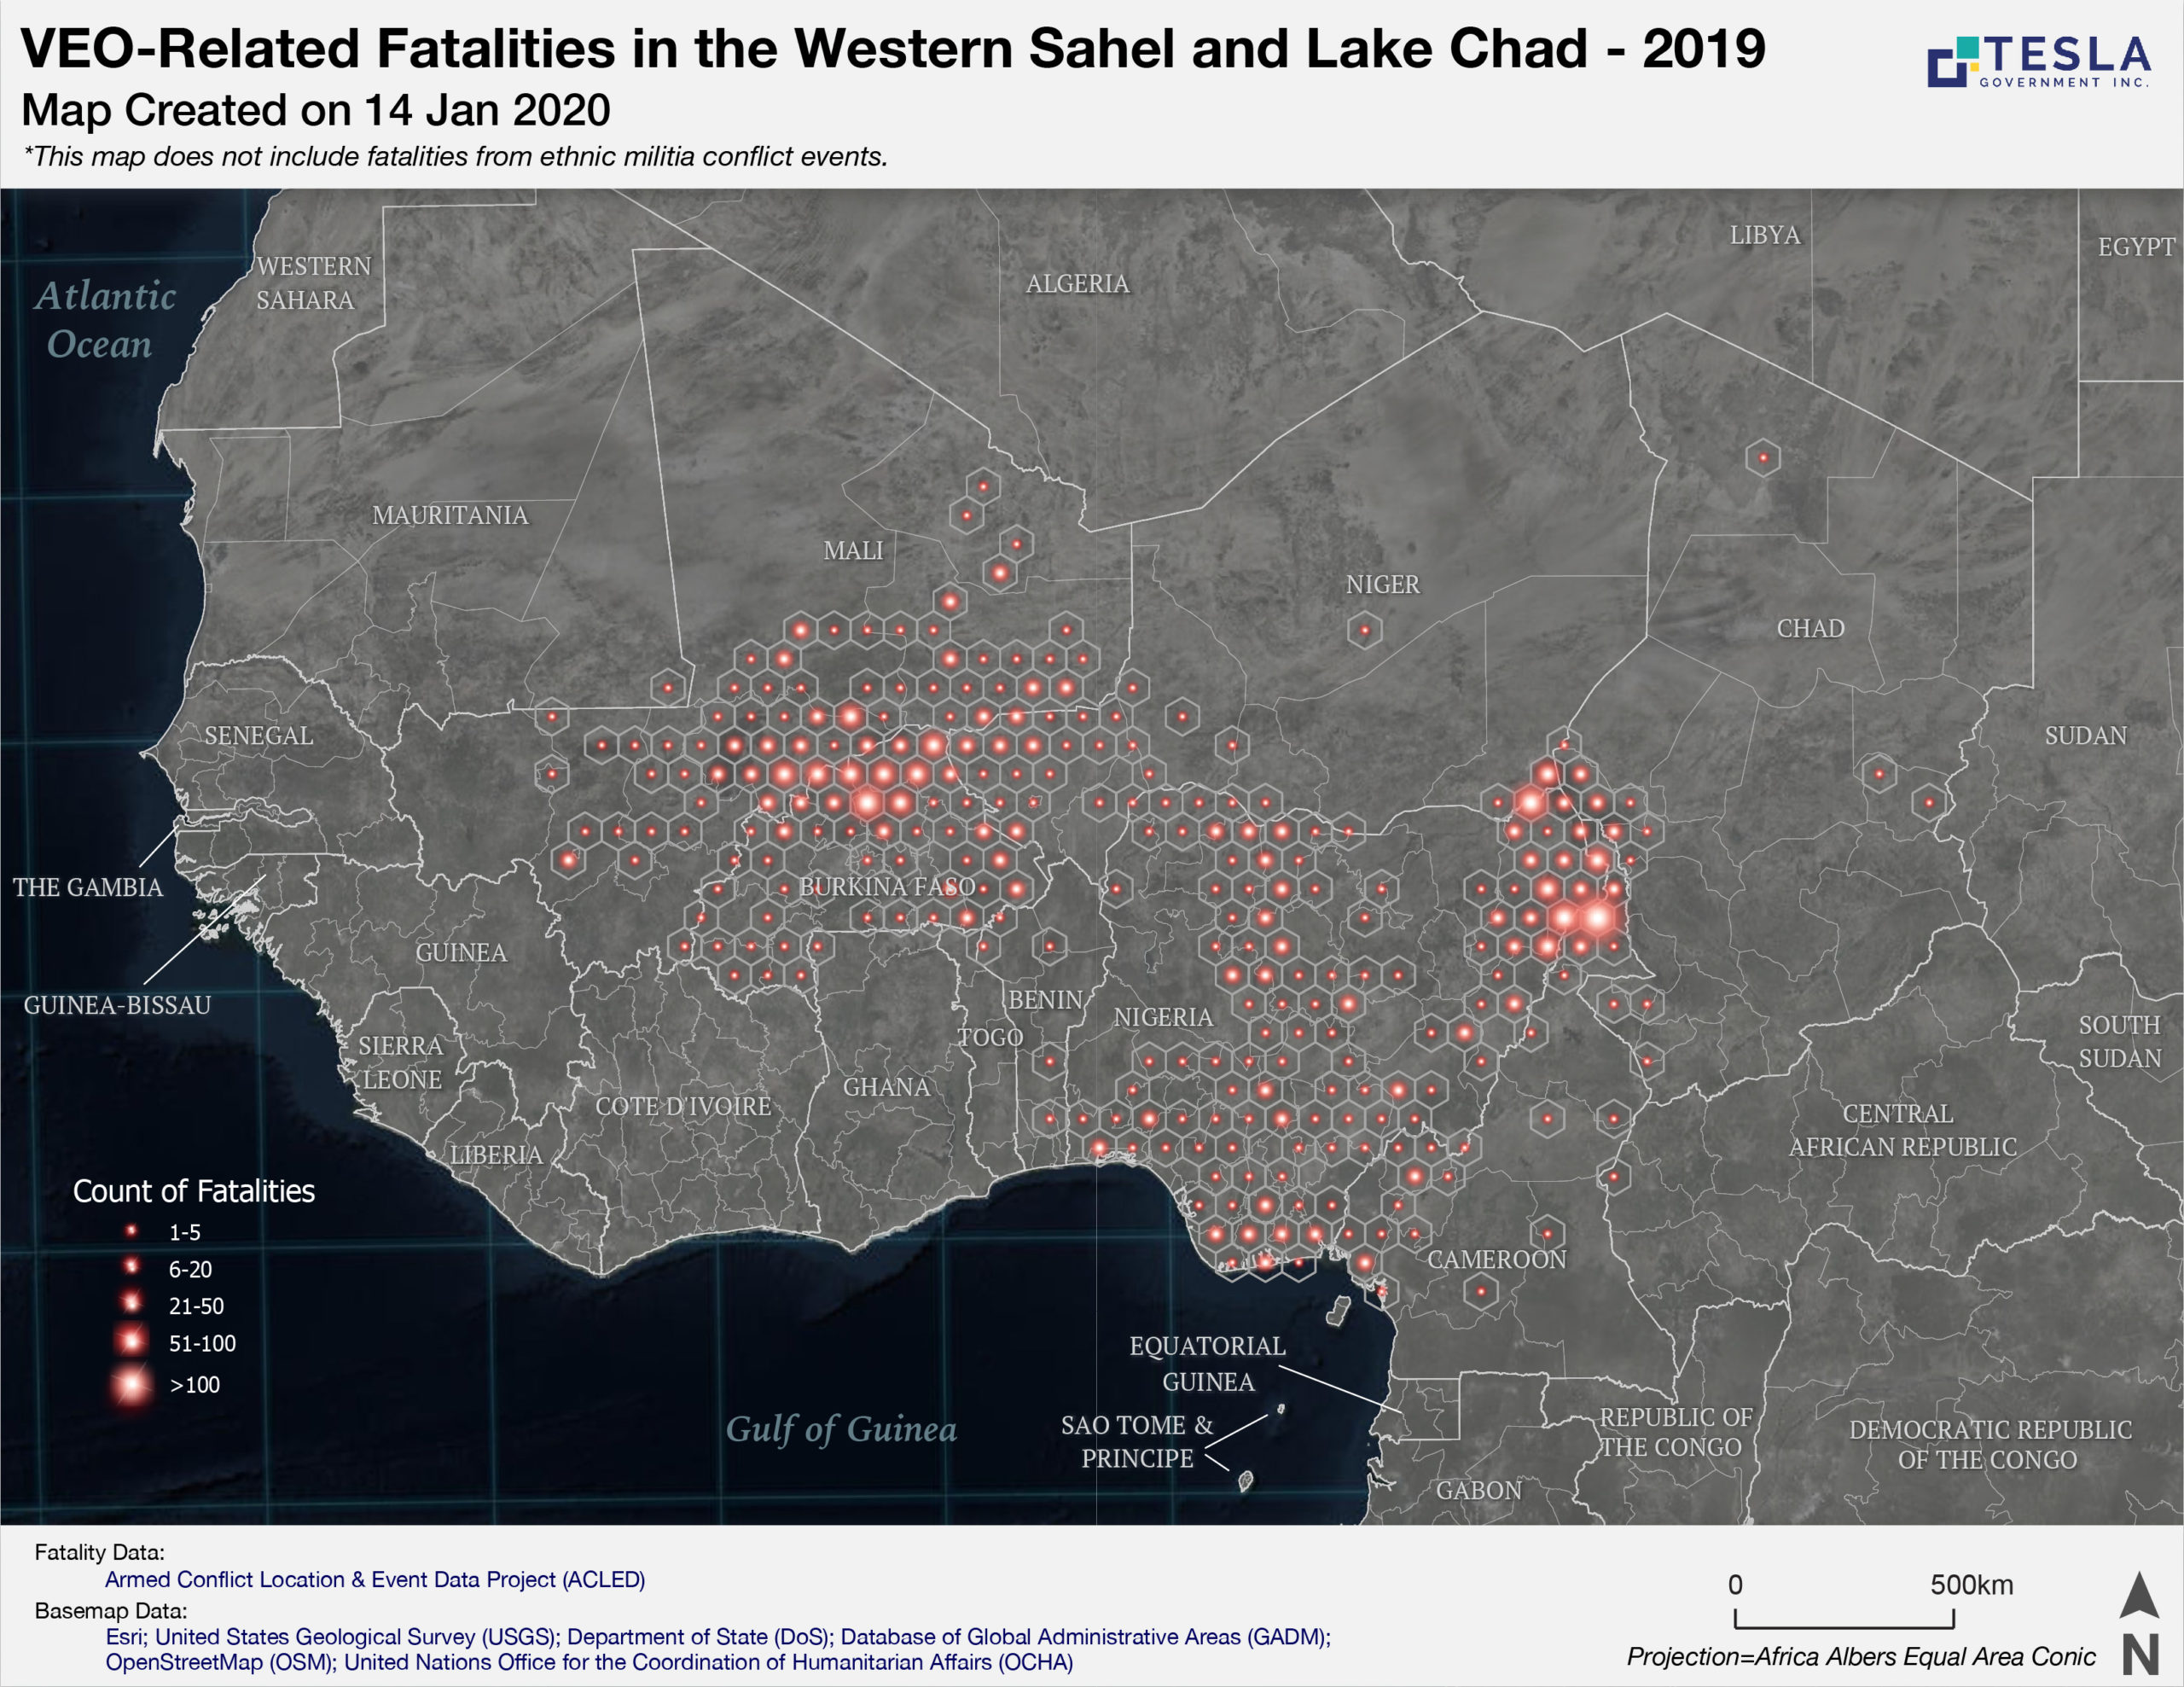
Data rarely speaks for itself.
The more data you have, the more difficult it is to spot trends and see the bigger picture. That’s where we come in.
Our data visualization team excels at turning mountains of unanalyzed data into powerful visuals. With our deliverables in hand, you and your stakeholders can quickly grasp the information and make informed decisions with greater confidence.
Spreadsheets and data points are great, but can you quickly spot a trend or make a decision by scrolling through mountains of data? We didn’t think so.
Our streamlined, flexible process allows us to hit quick turnarounds and help you succeed when you're down to the wire. Data visualization makes a difference if:
- You need clear visuals to show what the data actually means.
- You need help telling the story hidden in your data.
- You waste too many hours creating visuals to communicate more effectively.
- You are stuck choosing between doing something well or doing it fast.
Our Data Visualization Process
Our team has a diverse mix of experience (including military, NGOs, government, and academia) and deep expertise with Esri, ArcGIS, Adobe, and other GIS tools. We understand the challenge of revealing the story hidden in your data. We create a wide range of deliverables: web/interactive/static maps and apps, presentations, infographics, custom graphics, charts, reports, and data analysis.
Whatever the format, the result is the same. You will clearly see the real-world impact of events, policies and programs, and have deeper insight to guide your decision-making.
Latest Data Visualization Articles
See the Big Picture – Decide With Confidence
Data Visualization helps to grasp and communicate the story your data is telling. It works seamlessly with our other services to unleash your information:
Knowledge Management
Know you have the latest, accurate, and in focus information, at your fingertips.
Open-Source Research
Add context and perspective so you can make critical decisions with confidence.


